
Average Retirement Age: Americans Retire Earlier Than Planned
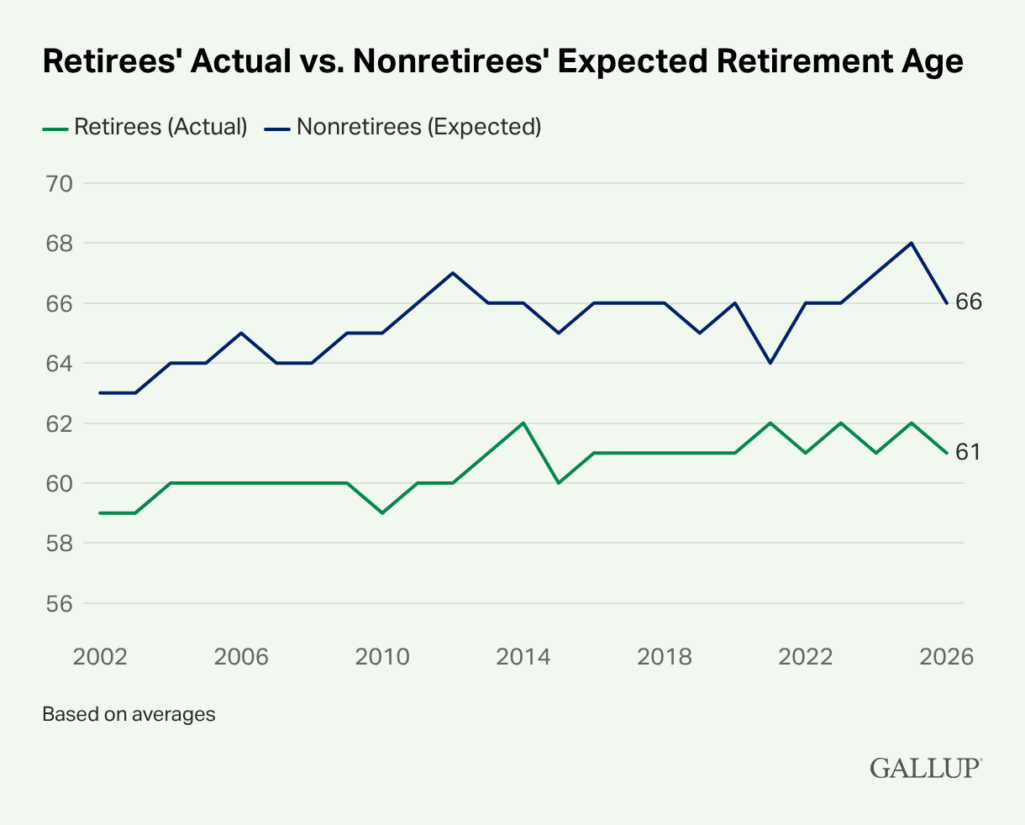
The average retirement age in the U.S. is 61. Most non-retirees expect to retire at 66. That five-year gap has held steady for two decades, according to Gallup’s April 2026 survey. About 46% of retirees left the workforce earlier than they planned, most often due to layoffs, health problems, or caregiving demands. The most common Social Security claiming ages are 62 and 66, based on 2023 SSA data.
If you’re planning to retire at 66, that’s a reasonable goal. Most people set the same target. Most also end up retiring about five years earlier than they planned. Knowing where the average retirement age lands is a key step toward a plan that holds up.
If you’re thinking about retiring and wondering whether the timing is right, this guide can help you decide.

The Average Retirement Age Is 61, Not the 66 Most People Expect
Gallup has tracked this question for more than two decades. Its April 2026 survey puts the actual average retirement age at 61. The actual figure has risen over that time, from 57 in 1991 to 61 today. The target most workers set, 66, hasn’t changed. That persistence suggests most Americans are running into forces that push retirement earlier than planned, regardless of intention.
Those five years carry real financial weight. They cut into contributions while extending withdrawals, and they often arrive before Medicare starts or you’ve made your Social Security decisions.
Different data sources put the average retirement age anywhere from 61 to 65.5. None of them are wrong. They just measure different things. Self-reported surveys, Social Security claims data, and labor force participation analysis each tell a different piece of the story.
The Most Common Age to Claim Social Security Is 66, but 23% Still File at 62
According to 2023 SSA claims data analyzed by Bankrate, the most popular age to file for Social Security is 66, followed by 62. The weighted average age of newly retired workers filing for benefits was 65.2 for both men and women in 2023, up from about 64 in 1998.
Here’s how the 2023 claiming ages break down:
| Age | Share of new claimants | Avg. monthly benefit |
| 62 | 23.2% | $1,292.60 |
| 63 | 6.4% | $1,498.23 |
| 64 | 6.9% | $1,657.09 |
| 65 | 11.3% | $1,916.33 |
| 66 | 34.1% | $2,106.15 |
| 67 | 4.2% | $2,487.84 |
| 68 | 2.4% | $2,750.48 |
| 69 | 2.1% | $2,923.64 |
| 70–74 | 9.1% | $3,162.09 |
Source: 2023 data from SSA Annual Statistical Supplement, 2024, via Bankrate
Social Security’s full retirement age is now 67 for anyone born in 1960 or later. That’s where your benefits reach their full amount. Retiring at or before 62 doesn’t require claiming early. You can delay benefits up to age 70 even if you’ve already stopped working.
39% of Workers Expect to Retire at 70 or Later, but Most Won’t
Gallup’s April 2026 data shows that the actual average retirement age has risen from 57 in 1991 to 61, but the target workers set hasn’t moved.
The latest research on this from the Transamerica Center for Retirement Studies’ 25th Annual Retirement Survey finds:
- 39% of workers expect to retire at 70 or older, or don’t plan to retire at all (23% expect 70+; 16% have no retirement plans)
- 10% expect to retire between ages 66 and 69
- 21% expect to retire at 65
- 29% expect to retire before 65
Why Do Most People Retire Earlier Than They Planned?
Most retirements arrive ahead of schedule. According to EBRI’s 2026 Retirement Confidence Survey, 46% of retirees left the workforce earlier than planned. In 76% of those cases, circumstances outside their control drove the decision: a health problem, a layoff, or a family member who needed care.
Knowing that doesn’t have to be discouraging. Your plan just needs to account for it.
Guardian Life’s 2025 analysis found the pandemic briefly reversed a two-decade trend toward later exits. By Q3 2021, 50.3% of U.S. adults 55 and older reported being out of the labor force due to retirement.
If you’re forced out of work before you planned to retire, here are 6 steps you can take.
Fewer Than Half of Workers Now Expect to Work Full-Time Past 62
The pandemic changed what workers expect. A May 2024 NY Fed analysis found the share of workers expecting to work full-time past 62 fell to a series low of 45.8% in March 2024, down from a pre-pandemic average of 54.6%. That drop cut across age groups, education levels, and income brackets, and was larger for women than for men.
The longer-term structural picture points the other way. A 2023 Pew Research report found adults 65 and older are projected to make up 8.6% of the labor force by 2032, up from 6.6% in 2022. Older adults will account for 57% of labor force growth over the next decade. Early retirement spiked during the pandemic. The long-term trend is toward working later.
Why Do Average Retirement Age Statistics Vary So Much?
No single source measures retirement age the same way. Gallup uses self-reported surveys. The SSA tracks when people claim benefits. The Center for Retirement Research (CRR) at Boston College measures when labor force participation falls below 50%. Each method gives a different number.
The CRR measure has a known limitation. It includes people who never intended to work, like full-time homemakers and people with disabilities. That pushes the number younger than it should be.
The Economic Policy Institute argues a more accurate method looks at when half of the non-disabled workforce has exited. By that measure, the average retirement age is 65.5.
Retirement Age Varies by More Than Four Years Across U.S. States
The average retirement age ranges from 61 in Alaska and West Virginia to well above 65 in Hawaii, Massachusetts, and South Dakota. Where you live can affect when you’re likely to retire.
Earliest retirement states (avg. age 61–62):
- Age 61: Alaska, West Virginia
- Age 62: New Mexico, Michigan, Louisiana, Kentucky, Arkansas, Oklahoma, Alabama
Middle retirement states (avg. age 63–64):
- Age 63: Oregon, Maine, Delaware, Nevada, Arizona, North Carolina, Georgia, Indiana, South Carolina, Ohio, Missouri, Mississippi
- Age 64: California, New York, Washington, Florida, Wisconsin, Illinois, Idaho, Pennsylvania, Montana, Wyoming, Tennessee
Latest retirement states (avg. age 65+):
- Age 65: Connecticut, New Jersey, Maryland, Vermont, Rhode Island, Minnesota, Colorado, New Hampshire, Virginia, Utah, North Dakota, Iowa, Nebraska, Texas, Kansas
- Later than 65: Hawaii, Massachusetts, South Dakota
Job availability, income levels, cost of living, and the demands of local industries all shape these differences. States with more manufacturing and manual labor tend to see earlier exits.
The Share of Americans Retiring in Their 50s Has Nearly Halved Since 2000
Early retirement isn’t what it used to be. The percentage of Americans retiring between 50 and 54 dropped from 9% to 6% over two decades. Those retiring between 55 and 59 fell from 19% to 11%. The pandemic created a spike, but the structural trend points toward later exits.
Fewer adults in their 60s are retired now than a generation ago. Between 2002 and 2007, 41% of U.S. adults ages 60 to 64 were retired. Between 2016 and 2022, that fell to 32%.
The post-pandemic picture is more complicated. Workers report much lower expectations of working full-time past 62, but many who retired early have since returned to work. The NY Fed describes the shift as “persistent” and “broad-based across age, education, and income groups.”
Longer retirements are part of what’s driving the complexity. Life expectancy at 65 has grown from 12.7 years for men and 14.7 years for women in 1940 to roughly 17.5 and 20.2 years today, according to SSA historical life expectancy data and CDC 2022 vital statistics.
A retirement that runs 20-plus years calls for a different plan than one built around 12 years. If you’re building a plan that accounts for a long life, see our guide on how much money you need if you live to 100.
The U.S. Retirement Age Is Near the Middle of the Global Range
Americans retire later than workers in China, Russia, and the Philippines, and earlier than those in Denmark, Iceland, and Finland.
| Country | Statutory Retirement Age | Notes |
| China | 63 (men); 55–58 (women) | Raised from 60/50–55 effective January 2025; phasing in through 2040 |
| Russia | 63 (men); 58 (women) | Rising to 65/60 by 2028; reformed from 60/55 starting 2019 |
| Philippines | 60–65 | Optional retirement at 60; mandatory at 65; varies by sector |
| United States | 61–65.5 (varies by measure) | |
| Denmark | 67 | Rising to 68 in 2030 |
| Iceland | 67 | |
| Finland | 65 | Projected to reach 68–69 by ~2060 via life-expectancy indexing |
Sources: OECD Pensions at a Glance 2025; World Population Review 2026
Most countries have passed legislation to raise retirement ages as life spans grow.
How to Build a Plan That Holds Up If You Retire 5 Years Early
A plan that only works at your target date is half a plan. Modeling what happens if you retire at 61 instead of 66 is where planning becomes protective.
Five years changes the math in four specific ways, and each one compounds the others:
1. Fewer contributions, more withdrawals. Retiring at 61 instead of 66 means five fewer years of saving and five more years of drawing down. On a $500,000 portfolio, that gap can represent hundreds of thousands of dollars in lost growth, depending on your contribution rate and market returns. The earlier the exit, the longer your money has to last.
2. Social Security timing becomes a lever, not a given. Retiring at 61 doesn’t mean claiming at 61. You can delay Social Security up to age 70 even if you stop working. Each year you wait increases your benefit by roughly 6–8%. If you can fund the gap from savings or part-time work, delaying benefits can significantly improve lifetime income. Claiming early because you need the money is different from claiming early because it fits your plan.
3. Healthcare coverage becomes your first problem to solve. Medicare doesn’t start until 65. If you retire at 61, you’re covering four years on your own: through a spouse’s plan, COBRA, marketplace insurance, or other options. Marketplace premiums for a 62-year-old average over $800/month before subsidies. That’s a real budget line most early retirees underestimate.
4. Your withdrawal rate needs a wider margin. A 30-year retirement (retiring at 65, living to 95) already tests the limits of a safe withdrawal rate. A 35-year retirement (retiring at 61) pushes further into uncertain territory. Stress-testing your withdrawal rate at both timelines (and identifying where the plan breaks) is how you find out whether you need to save more, spend less, or build in more flexible income sources.
Once you’re ready to model the numbers, the Boldin Planner lets you run both scenarios side by side — savings, spending, Social Security timing, and income sources — so you can see exactly where each one lands and what levers you have left to pull.
Frequently Asked Questions
The most-cited average retirement age in the U.S. is 61, based on Gallup’s self-reported survey data. Other measures give higher numbers. The SSA’s 2023 weighted average for new benefit claimants is 65.2. Labor force participation analysis puts it at 64 for men and 62 for women. The number shifts depending on what’s being measured and who’s included.
Most Americans who retire early don’t choose to. About 60% are pushed out by circumstances outside their control, like a health problem, a layoff, or a caregiving demand. The space between expected (66) and actual (61) retirement age has held steady for two decades, per Gallup’s April 2026 survey. That gap reflects unplanned exits more than financial readiness.
The most popular age to claim Social Security benefits in 2023 was 66, chosen by 34.1% of new claimants, followed by 62 at 23.2%. Claiming at 62 reduces your monthly benefit by up to 30%. Waiting until 70 maximizes it. The weighted average claiming age across all new retirees in 2023 was 65.2 for both men and women.
Retirement age varies by more than four years across U.S. states. Alaska and West Virginia average 61, the earliest in the country. Hawaii, Massachusetts, and South Dakota average well above 65. Local labor markets, cost of living, and industry mix all contribute to the variations.
Early retirement has been declining for two decades and spiked during the pandemic. The share retiring between 50 and 54 fell from 9% to 6% between 2000 and 2024. Those retiring between 55 and 59 dropped from 19% to 11%. The pandemic created a reversal. Long-term, older adults will account for 57% of labor force growth through 2032.
About five years separates what Americans plan and what happens. Non-retirees target 66; most retire at 61. That difference is driven mostly by unplanned exits. A plan that works for both your target date and an earlier forced exit is the most practical approach.
The post Average Retirement Age: Americans Retire Earlier Than Planned appeared first on Boldin.